Shruti Wagh


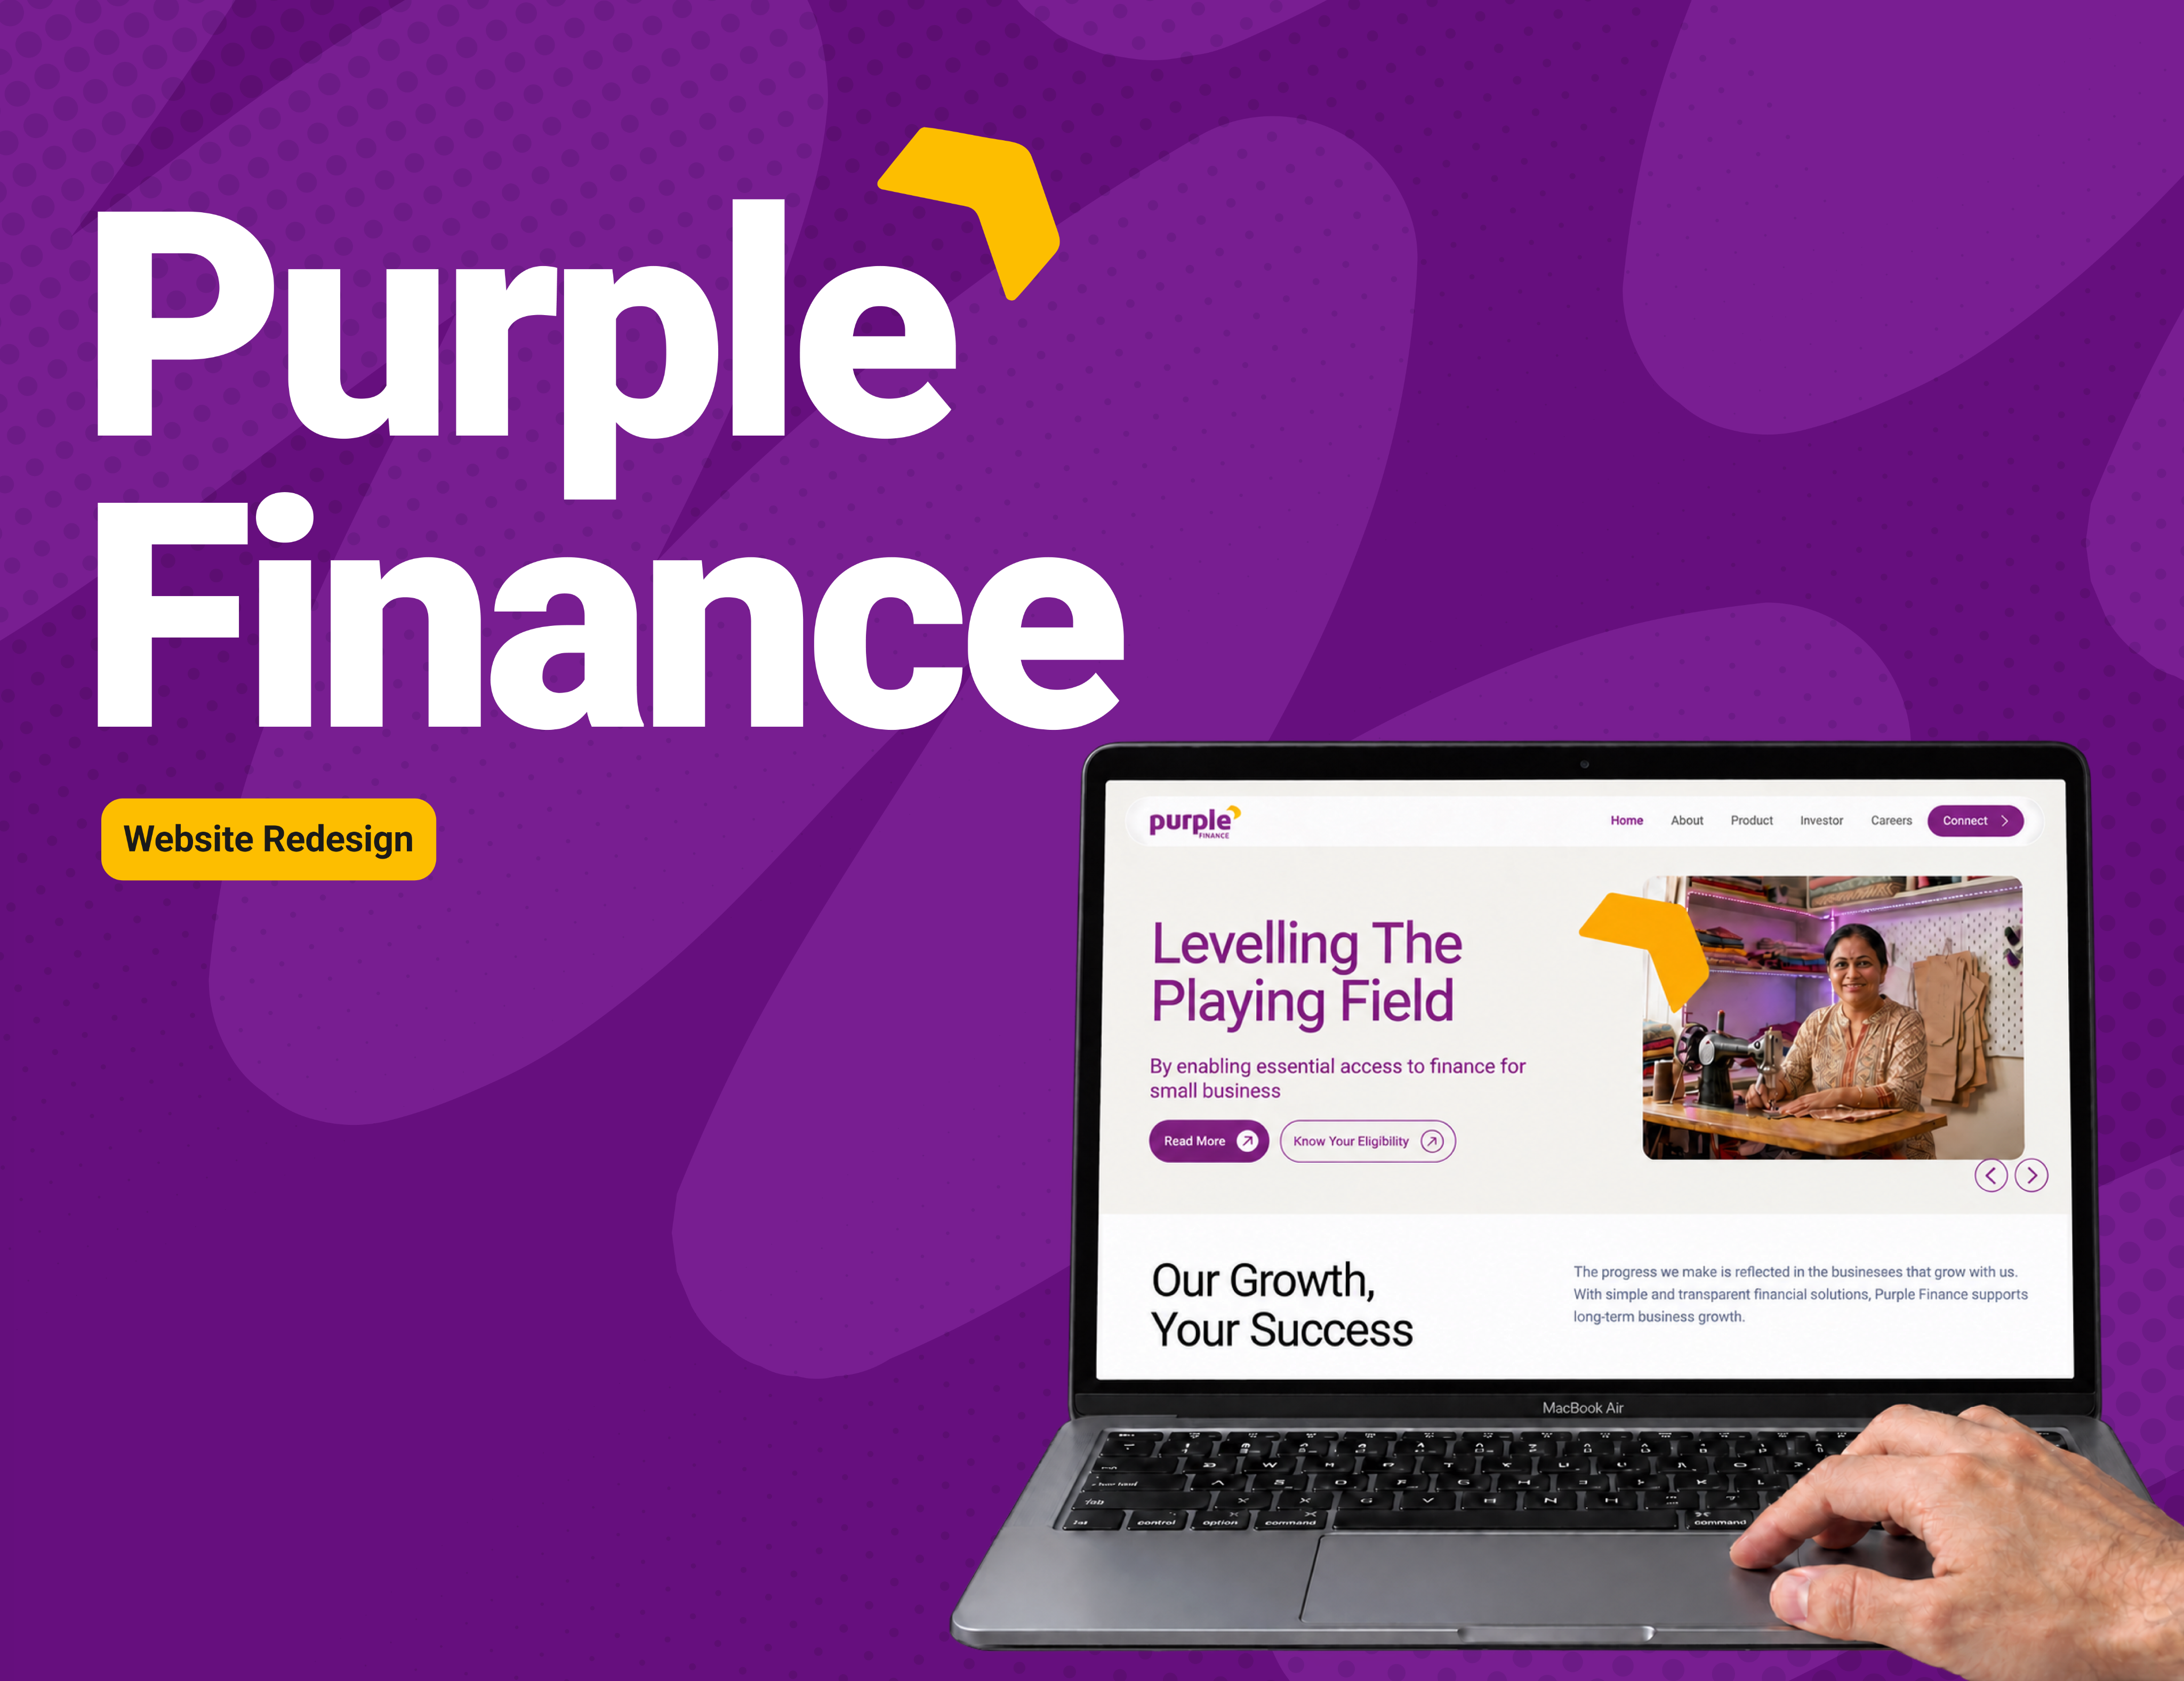
Website Design
Design Consultant
Purple Finance

Live now
UI & UX Design
Designing the end-to-end UI for a no-code AI agent platform — enabling customer-facing businesses to deploy intelligent support agents without any technical overhead.
Project Overview
A visual refresh became an interface redesign.
Purple Finance asked for a website redesign without a detailed UX brief. I approached it by looking at the interface: what attracts attention first, how sections relate to one another, where actions sit, and how consistently the pages behave as a family. The goal was to make a complex financial website feel more organised and easier to navigate.
Problem
Users struggled to find key loan information and understand what to do next.
The old website had the right information, but the experience felt visually busy and inconsistent. Visitors had to work harder to understand what was important, what they could do next and how different sections related to each other.
01
Competing attention
Large photographs, heavy headings and bright panels often competed with the message and actions.
02
Hidden information
Documents and supporting details sat behind unclear controls, making important information easy to miss.
03
Unclear actions
Labels such as “Explore” did not explain what would happen next, while primary and secondary actions lacked hierarchy.
04
Inconsistent UI
Colours, card styles, spacing, icons and page structures changed across the website, weakening recognition.
Design process
I kept the process practical: understand the current experience, identify repeated problems, study familiar patterns, redesign the key journeys and review the new screens against the original issues.

Audit
Reviewed hierarchy, navigation, readability, grouping, action labels and consistency across the old screens.

Benchmark
Studied Axis Bank and ICICI Bank for familiar ways of organising navigation, products and actions.

Structure
Reduced top-level navigation and grouped related information across pages and the footer.

Redesign
Created clearer layouts, visible information groups, meaningful icons and consistent UI patterns.

Review
Compared the redesign with the audit findings and noted what still needs validation.
Design Strategy
Redesign was guided by a few simple principles. Each principle helped turn a visual change into a clearer experience.
01
Create a clear order of attention
Large headings, quieter supporting text and distinct actions use visual hierarchy to show what to read and do first.
02
Reduce choice in the header
Fewer top-level links make navigation easier to scan. This follows Hick’s Law: decision time increases as the number and complexity of choices grow.
03
Keep related information together
Eligibility, documents, calculator inputs and results are placed in clear groups. Gestalt principles of proximity and common region make relationships easier to understand.
04
Use repetition to build familiarity
Repeated cards, icons, buttons and spacing support recognition over recall. Visitors do not have to relearn the interface on every page.
05
Show useful information at the right time
Documents are visible, while longer profiles can remain behind a clear detail action. This uses progressive disclosure without hiding essential information.
06
Use contrast with purpose
Purple surfaces separate important sections and results; neutral areas support detailed reading. Contrast and scale create emphasis, while accessibility still requires testing.
Key Changes
The redesign reduced the complexity. It reorganised the same experience so the message, information and actions became easier to recognise.
- Homepage
Before
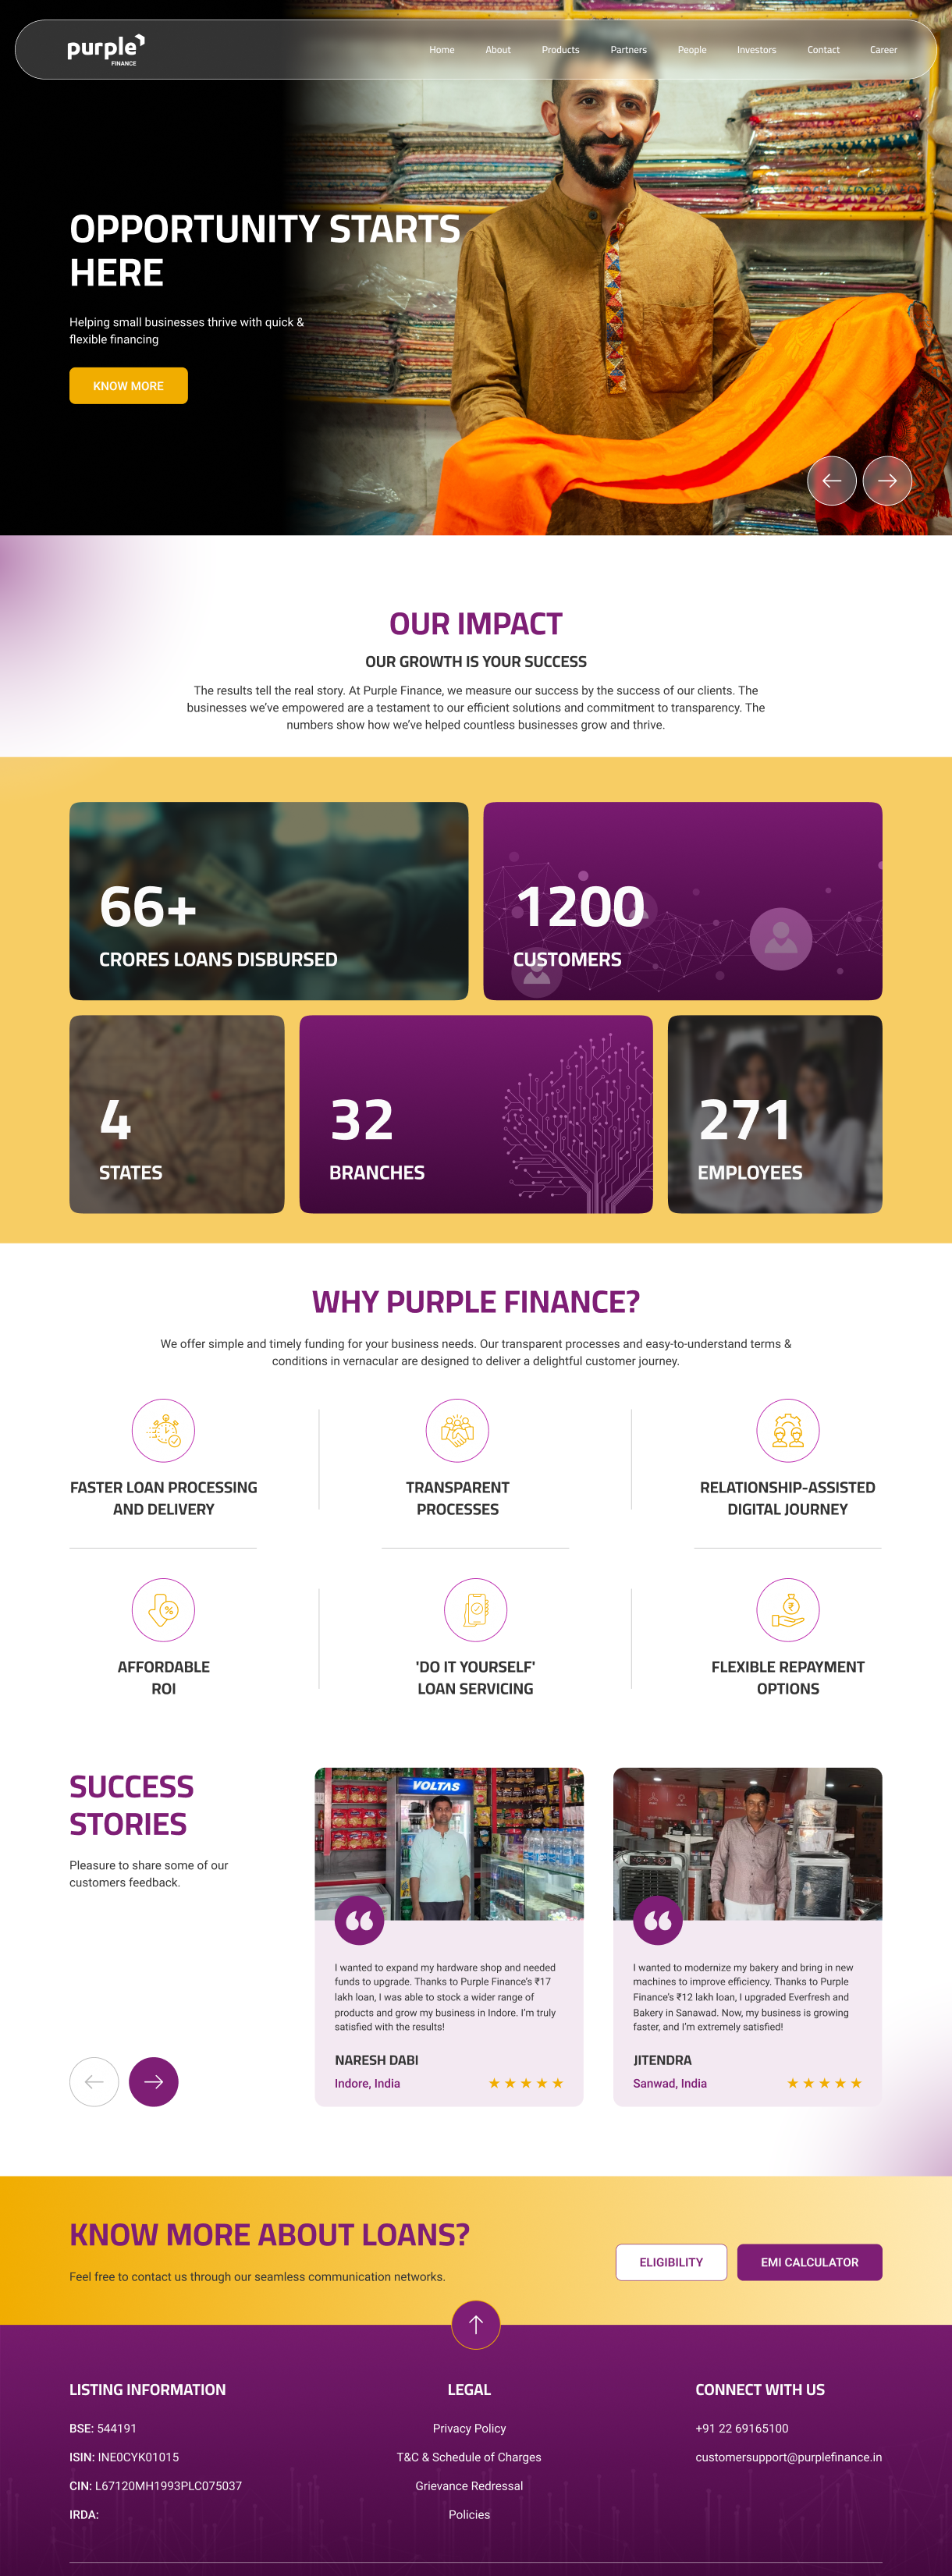
Before
- Cluttered navigation: Too many competing labels and poor legibility made navigation difficult to scan. No primary CTA established a clear next step.
- Weak hero hierarchy: The headline competed with a full-width image for attention, while a vague CTA offered little direction.
- Visually dense impact cards: Competing elements weakened the information hierarchy, increasing cognitive load and making key figures harder to find.
- Low calculator discoverability: The eligibility calculator sat far down the page, requiring users to scroll extensively to access it.
Now
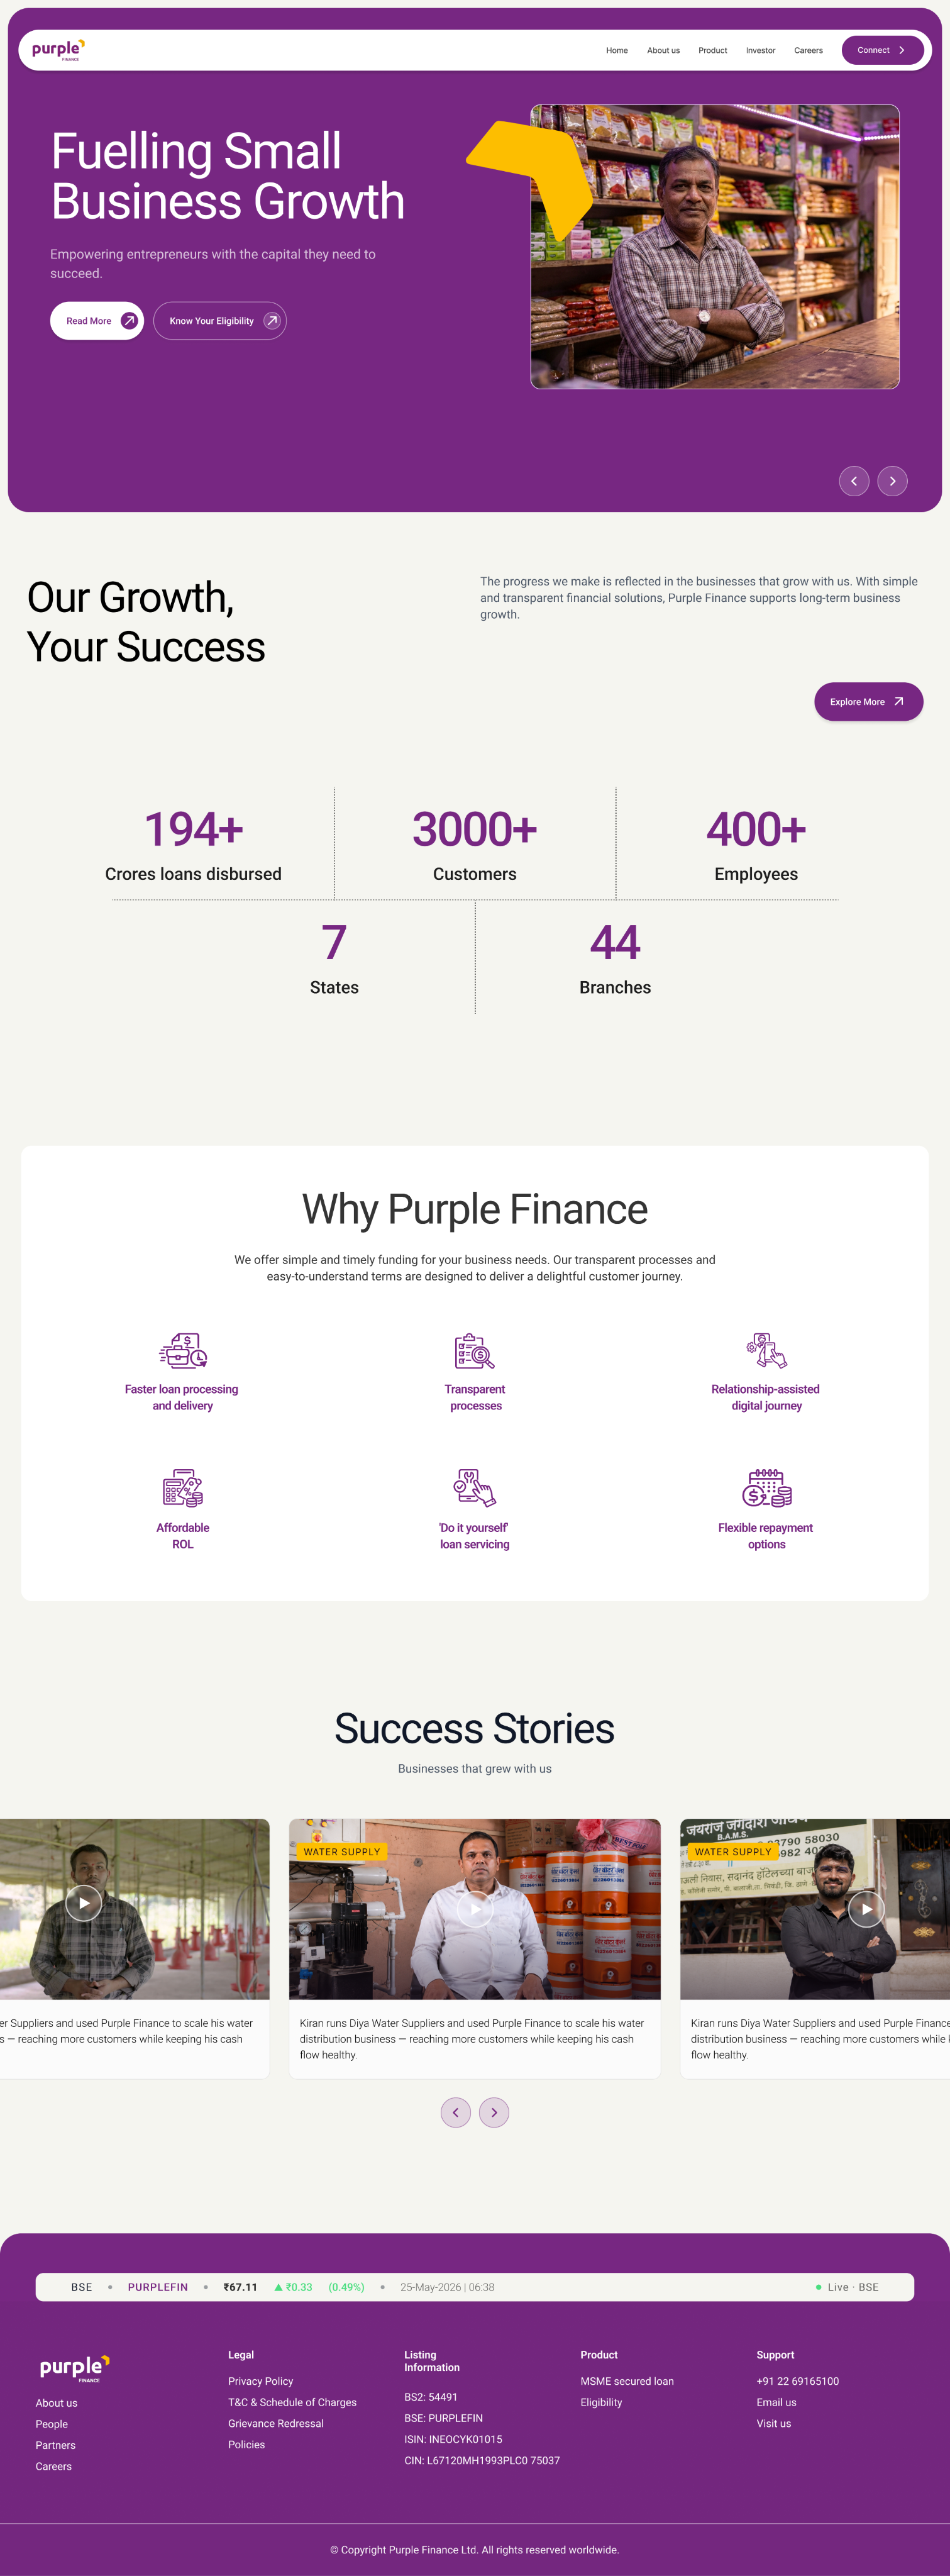
Now
- Clearer navigation: Simplified labels and a prominent primary CTA make key destinations easier to find and establish a clear next step.
-
- Stronger hero hierarchy: Separate text and image zones improve readability. Filled and outlined buttons distinguish primary and secondary actions.
-
- Scannable impact figures: Reduced visual clutter and stronger emphasis on numbers make key statistics (Business impact) easier to absorb at a glance.
-
- Progressive disclosure: An “Explore Now” CTA lets users access detailed information without overwhelming the homepage.
-
- Earlier access to eligibility: Bringing the calculator higher on the page improves discoverability and lets users check eligibility sooner.
- Product Page
Before
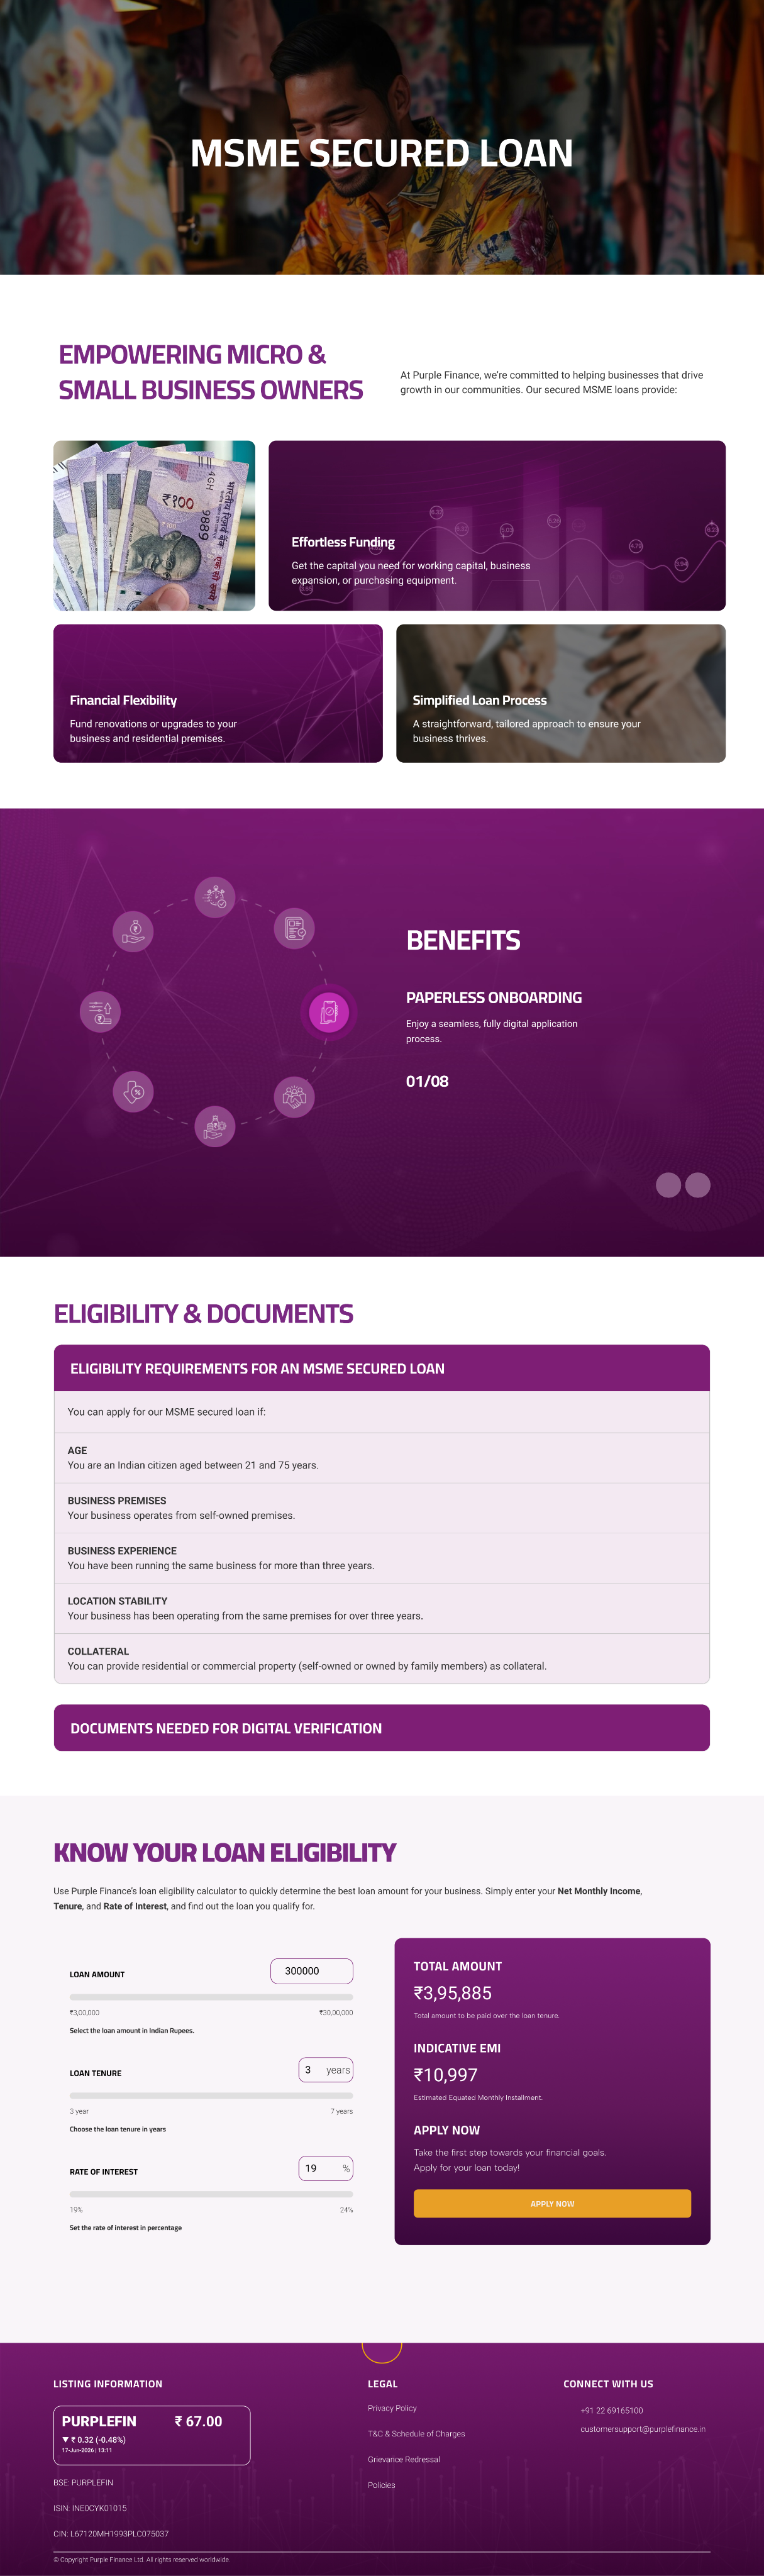
Before
- Unclear hero context: The hero image offered little context about the page’s purpose or loan offering.
- Visually cluttered cards: Placing the three fundamentals over imagery created competing focal points. Inconsistent contrast weakened readability and increased visual complexity.
- Hidden benefits: A rotating carousel limited visibility to one benefit at a time, increasing interaction effort and making comparison harder.
Now
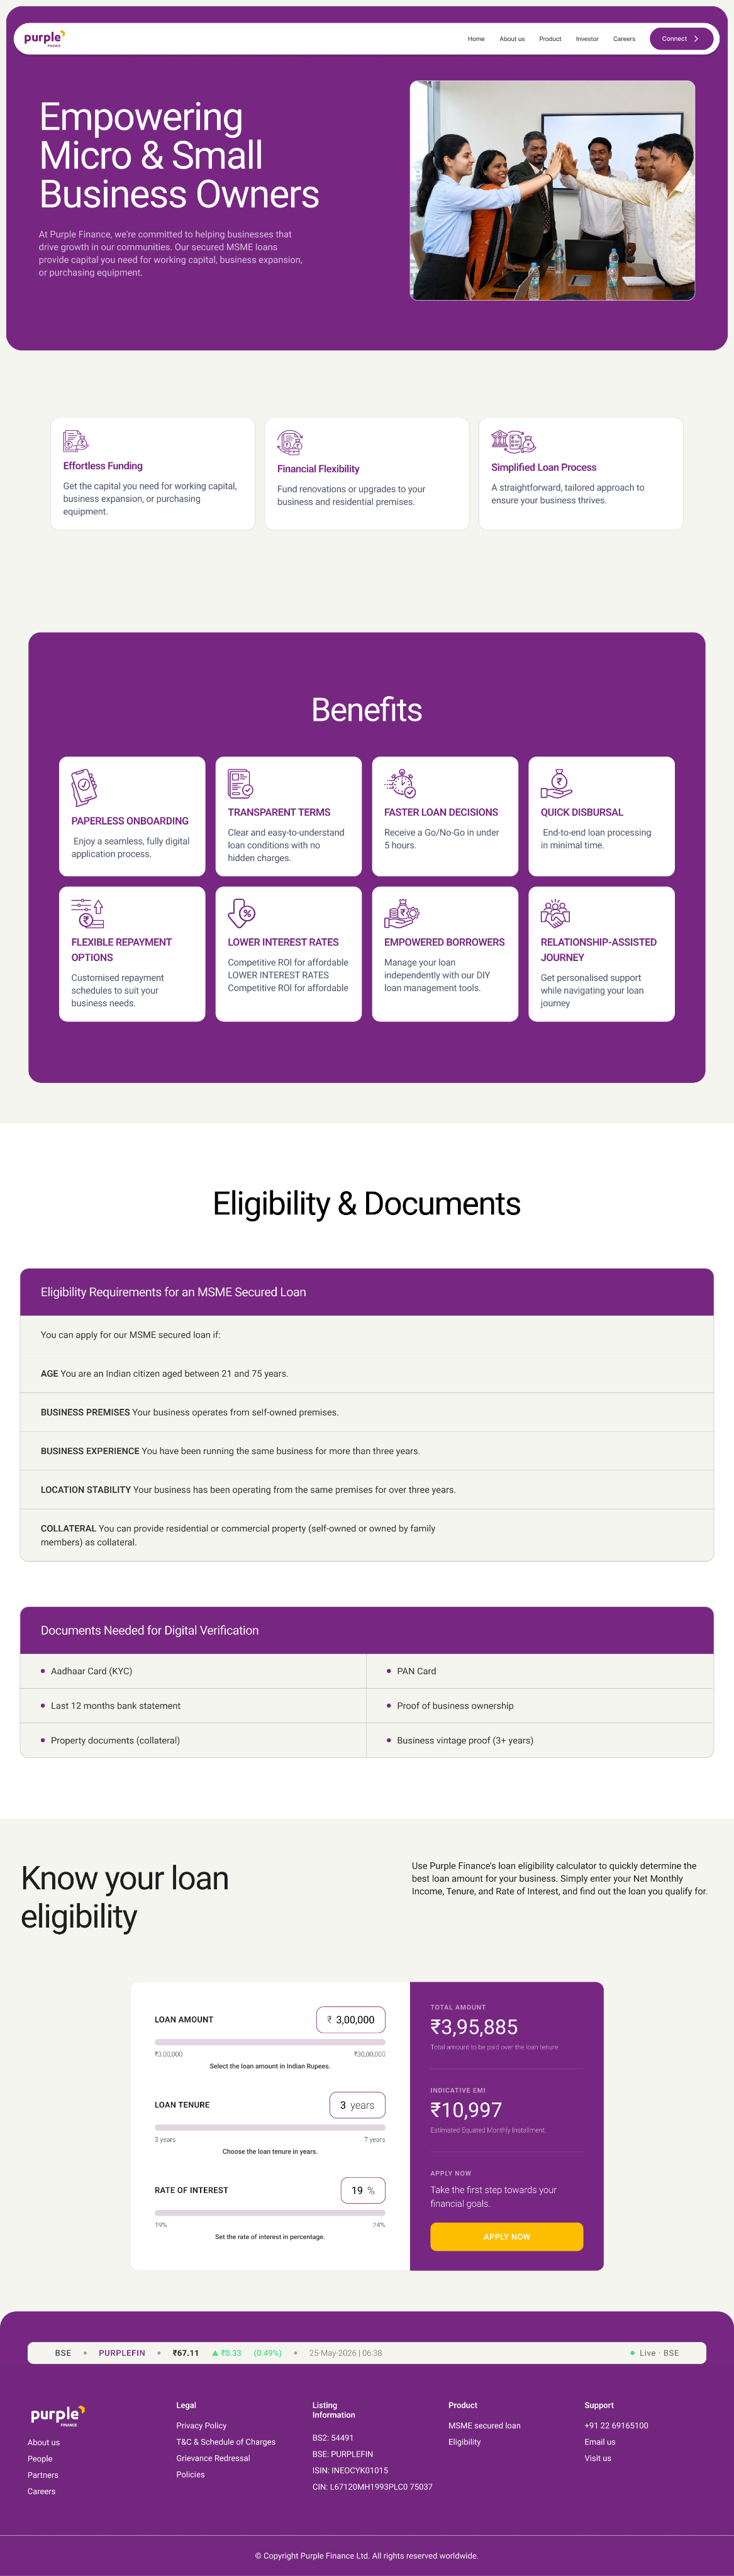
Now
- Relevant hero content: A clear headline and supporting imagery communicate the page’s purpose and establish a stronger visual hierarchy.
- Readable feature cards: Clean backgrounds, clear contrast and contextual icons make the three fundamentals easier to scan and understand.
- Benefits visible together: Displaying all benefits in one view reduces interaction effort and supports easier comparison and informed decisions.
- Related information grouped together: Placing required documents beside eligibility details supports recognition over recall and reduces the need to search.
- Structured calculator layout: Grouped inputs follow the Gestalt principle of proximity, while a contrasting results panel highlights the outcome and application CTA.
80% ↑
Clearer scanning
Visitors can distinguish headings, supporting text, information groups and actions more quickly.
100% ↑
Better findability
Eligibility, required documents, calculator results and support links are more visible in the flow.
75% ↑
Consistent experience
Shared navigation, cards, icons, spacing, colours and footer patterns connect the pages as one product.
What I would validate next
Test whether prospective borrowers can find eligibility, identify required documents, estimate an EMI and begin an application. I would also check mobile behaviour, keyboard navigation, focus states, colour contrast, error states and carousel controls.
A visual refresh becomes meaningful UX work when every change has a clear purpose—organising attention, reducing uncertainty and making the next step easier to find.
Website Design
Design Consultant
Purple Finance

Live now
UI & UX Design
Purple Finance provides secured business loans to micro, small and medium enterprises (MSMEs) in India. Its website helps business owners explore loan offerings, understand benefits and documentation requirements, and check their eligibility before applying.
Project Overview
A visual refresh became an interface redesign.
Purple Finance asked for a website redesign without a detailed UX brief. I approached it by looking at the interface: what attracts attention first, how sections relate to one another, where actions sit, and how consistently the pages behave as a family. The goal was to make a complex financial website feel more organised and easier to navigate.
Problem
Users struggled to find key loan information and understand what to do next.
The old website had the right information, but the experience felt visually busy and inconsistent. Visitors had to work harder to understand what was important, what they could do next and how different sections related to each other.
01
Competing attention
Large photographs, heavy headings and bright panels often competed with the message and actions.
02
Hidden information
Documents and supporting details sat behind unclear controls, making important information easy to miss.
03
Unclear actions
Labels such as “Explore” did not explain what would happen next, while primary and secondary actions lacked hierarchy.
04
Inconsistent UI
Colours, card styles, spacing, icons and page structures changed across the website, weakening recognition.
Design process
I kept the process practical: understand the current experience, identify repeated problems, study familiar patterns, redesign the key journeys and review the new screens against the original issues.
Audit
Reviewed hierarchy, navigation, readability, grouping, action labels and consistency across the old screens.
Benchmark
Studied Axis Bank and ICICI Bank for familiar ways of organising navigation, products and actions.
Structure
Reduced top-level navigation and grouped related information across pages and the footer.
Redesign
Created clearer layouts, visible information groups, meaningful icons and consistent UI patterns.
Review
Compared the redesign with the audit findings and noted what still needs validation.
Design Strategy
Redesign was guided by a few simple principles. Each principle helped turn a visual change into a clearer experience.
01
Create a clear order of attention
Large headings, quieter supporting text and distinct actions use visual hierarchy to show what to read and do first.
02
Reduce choice in the header
Fewer top-level links make navigation easier to scan. This follows Hick’s Law: decision time increases as the number and complexity of choices grow.
03
Keep related information together
Eligibility, documents, calculator inputs and results are placed in clear groups. Gestalt principles of proximity and common region make relationships easier to understand.
04
Use repetition to build familiarity
Repeated cards, icons, buttons and spacing support recognition over recall. Visitors do not have to relearn the interface on every page.
05
Show useful information at the right time
Documents are visible, while longer profiles can remain behind a clear detail action. This uses progressive disclosure without hiding essential information.
06
Use contrast with purpose
Purple surfaces separate important sections and results; neutral areas support detailed reading. Contrast and scale create emphasis, while accessibility still requires testing.
Key Changes
The redesign reduced the complexity. It reorganised the same experience so the message, information and actions became easier to recognise.
- Homepage
Before
Now
Before
- Cluttered navigation: Too many competing labels and poor legibility made navigation difficult to scan. No primary CTA established a clear next step.
- Weak hero hierarchy: The headline competed with a full-width image for attention, while a vague CTA offered little direction.
- Visually dense impact cards: Competing elements weakened the information hierarchy, increasing cognitive load and making key figures harder to find.
- Low calculator discoverability: The eligibility calculator sat far down the page, requiring users to scroll extensively to access it.
Now
- Clearer navigation: Simplified labels and a prominent primary CTA make key destinations easier to find and establish a clear next step.
- Stronger hero hierarchy: Separate text and image zones improve readability. Filled and outlined buttons distinguish primary and secondary actions.
- Scannable impact figures: Reduced visual clutter and stronger emphasis on numbers make key statistics (Business impact) easier to absorb at a glance.
- Progressive disclosure: An “Explore Now” CTA lets users access detailed information without overwhelming the homepage.
- Earlier access to eligibility: Bringing the calculator higher on the page improves discoverability and lets users check eligibility sooner.
- Product Page
Before
Now
Before
- Unclear hero context: The hero image offered little context about the page’s purpose or loan offering.
- Visually cluttered cards: Placing the three fundamentals over imagery created competing focal points. Inconsistent contrast weakened readability and increased visual complexity.
- Hidden benefits: A rotating carousel limited visibility to one benefit at a time, increasing interaction effort and making comparison harder.
Now
- Relevant hero content: A clear headline and supporting imagery communicate the page’s purpose and establish a stronger visual hierarchy.
- Readable feature cards: Clean backgrounds, clear contrast and contextual icons make the three fundamentals easier to scan and understand.
- Benefits visible together: Displaying all benefits in one view reduces interaction effort and supports easier comparison and informed decisions.
- Related information grouped together: Placing required documents beside eligibility details supports recognition over recall and reduces the need to search.
- Structured calculator layout: Grouped inputs follow the Gestalt principle of proximity, while a contrasting results panel highlights the outcome and application CTA.
80% ↑
Clearer scanning
Visitors can distinguish headings, supporting text, information groups and actions more quickly.
100% ↑
Better findability
Eligibility, required documents, calculator results and support links are more visible in the flow.
75% ↑
Consistent experience
Shared navigation, cards, icons, spacing, colours and footer patterns connect the pages as one product.
What I would validate next
Test whether prospective borrowers can find eligibility, identify required documents, estimate an EMI and begin an application. I would also check mobile behaviour, keyboard navigation, focus states, colour contrast, error states and carousel controls.
A visual refresh becomes meaningful UX work when every change has a clear purpose—organising attention, reducing uncertainty and making the next step easier to find.
Website Design
Design Consultant
Purple Finance
Live now
UI & UX Design
Purple Finance provides secured business loans to micro, small and medium enterprises (MSMEs) in India. Its website helps business owners explore loan offerings, understand benefits and documentation requirements, and check their eligibility before applying.
Project Overview
A visual refresh became an interface redesign.
Purple Finance asked for a website redesign without a detailed UX brief. I approached it by looking at the interface: what attracts attention first, how sections relate to one another, where actions sit, and how consistently the pages behave as a family. The goal was to make a complex financial website feel more organised and easier to navigate.
Problem
Users struggled to find key loan information and understand what to do next.
The old website had the right information, but the experience felt visually busy and inconsistent. Visitors had to work harder to understand what was important, what they could do next and how different sections related to each other.
01
Competing attention
Large photographs, heavy headings and bright panels often competed with the message and actions.
02
Hidden information
Documents and supporting details sat behind unclear controls, making important information easy to miss.
03
Unclear actions
Labels such as “Explore” did not explain what would happen next, while primary and secondary actions lacked hierarchy.
04
Inconsistent UI
Colours, card styles, spacing, icons and page structures changed across the website, weakening recognition.
Design process
I kept the process practical: understand the current experience, identify repeated problems, study familiar patterns, redesign the key journeys and review the new screens against the original issues.
Audit
Reviewed hierarchy, navigation, readability, grouping, action labels and consistency across the old screens.
Benchmark
Studied Axis Bank and ICICI Bank for familiar ways of organising navigation, products and actions.
Structure
Reduced top-level navigation and grouped related information across pages and the footer.
Redesign
Created clearer layouts, visible information groups, meaningful icons and consistent UI patterns.
Review
Compared the redesign with the audit findings and noted what still needs validation.
Design Strategy
Redesign was guided by a few simple principles. Each principle helped turn a visual change into a clearer experience.
01
Create a clear order of attention
Large headings, quieter supporting text and distinct actions use visual hierarchy to show what to read and do first.
02
Reduce choice in the header
Fewer top-level links make navigation easier to scan. This follows Hick’s Law: decision time increases as the number and complexity of choices grow.
03
Keep related information together
Eligibility, documents, calculator inputs and results are placed in clear groups. Gestalt principles of proximity and common region make relationships easier to understand.
04
Use repetition to build familiarity
Repeated cards, icons, buttons and spacing support recognition over recall. Visitors do not have to relearn the interface on every page.
05
Show useful information at the right time
Documents are visible, while longer profiles can remain behind a clear detail action. This uses progressive disclosure without hiding essential information.
06
Use contrast with purpose
Purple surfaces separate important sections and results; neutral areas support detailed reading. Contrast and scale create emphasis, while accessibility still requires testing.
Key Changes
The redesign reduced the complexity. It reorganised the same experience so the message, information and actions became easier to recognise.
1. Homepage
Before
Now
Before
- Cluttered navigation: Too many competing labels and poor legibility made navigation difficult to scan. No primary CTA established a clear next step.
- Weak hero hierarchy: The headline competed with a full-width image for attention, while a vague CTA offered little direction.
- Visually dense impact cards: Competing elements weakened the information hierarchy, increasing cognitive load and making key figures harder to find.
- Low calculator discoverability: The eligibility calculator sat far down the page, requiring users to scroll extensively to access it.
Now
- Clearer navigation: Simplified labels and a prominent primary CTA make key destinations easier to find and establish a clear next step.
- Stronger hero hierarchy: Separate text and image zones improve readability. Filled and outlined buttons distinguish primary and secondary actions.
- Scannable impact figures: Reduced visual clutter and stronger emphasis on numbers make key statistics (Business impact) easier to absorb at a glance.
- Progressive disclosure: An “Explore Now” CTA lets users access detailed information without overwhelming the homepage.
- Earlier access to eligibility: Bringing the calculator higher on the page improves discoverability and lets users check eligibility sooner.
- Product Page
Before
Now
Before
- Unclear hero context: The hero image offered little context about the page’s purpose or loan offering.
- Visually cluttered cards: Placing the three fundamentals over imagery created competing focal points. Inconsistent contrast weakened readability and increased visual complexity.
- Hidden benefits: A rotating carousel limited visibility to one benefit at a time, increasing interaction effort and making comparison harder.
Now
- Relevant hero content: A clear headline and supporting imagery communicate the page’s purpose and establish a stronger visual hierarchy.
- Readable feature cards: Clean backgrounds, clear contrast and contextual icons make the three fundamentals easier to scan and understand.
- Benefits visible together: Displaying all benefits in one view reduces interaction effort and supports easier comparison and informed decisions.
- Related information grouped together: Placing required documents beside eligibility details supports recognition over recall and reduces the need to search.
- Structured calculator layout: Grouped inputs follow the Gestalt principle of proximity, while a contrasting results panel highlights the outcome and application CTA.
Design Impact
The redesigned website is live. It now presents a more consistent experience across pages, with clearer navigation, stronger hierarchy and more visible paths to eligibility, documents, the calculator and support.
80% ↑
Clearer scanning
Visitors can distinguish headings, supporting text, information groups and actions more quickly.
100% ↑
Better findability
Eligibility, required documents, calculator results and support links are more visible in the flow.
75% ↑
Consistent experience
Shared navigation, cards, icons, spacing, colours and footer patterns connect the pages as one product.
What I would validate next
Test whether prospective borrowers can find eligibility, identify required documents, estimate an EMI and begin an application. I would also check mobile behaviour, keyboard navigation, focus states, colour contrast, error states and carousel controls.
A visual refresh becomes meaningful UX work when every change has a clear purpose—organising attention, reducing uncertainty and making the next step easier to find.